Thursday, May 24, 2018

9 - Analytics 101: Classification, Demographics and Customer Behavior(s)


The goal of classification is to build rules or models and represent them in a simple readable form using past decisions.   There are multiple techniques that can accomplish this task of gleaning intelligence from existing data –Neural Networks, SVMs , Decision Trees and so on. We’ll focus on Decision Trees in this article since they sit well with the Marketing use cases like predicting conversion rates, buy decisions etc. Sounds obtuse? We’ll demystify this in a moment.
Who will buy a computer???Let’s Look at a computer dealer who has data about his customers and purchases – Age group, Credit Status and Customer Status ( is he a student or not) . He is trying to figure out if a new set of customers will be interested in buying a computer- eventually to send them discounted offers. Given his constraints on the level of discounting he can provide, how does he make use of past data about other customers who have already bought a computer to answer this question?Simple: He uses a decision tree which takes in the age group, income, credit status and customer type and tries to predict an outcome based on past customer decisions around buying a computer. The goal is to get to a state where the entropy is minimum ie information is as unambiguous as possible like the areas marked in red on the diagrambelow . Some interesting observations emerge.

Eg: One rule could be Students with a Low Income group at an age group < 30 never buy a computer. The 100 indicates the total number in the segment and 0 the no. of people who actually bought a computer.Another possible rule could be Non –Students with Poor credit histories rarely buy a computer.This model built on past decisions can then be extrapolated to answer a similar question about a new customer / prospect. Will the new guy be interested in buying a computer or does it make no sense sending him an offer? One caveat is that some of these insights could really be no-brainers – something that is so logical, you wouldn’t need to go through all this hassle to find out- like blind customers don’t buy TV OR Turkey sales go up in Easter !!
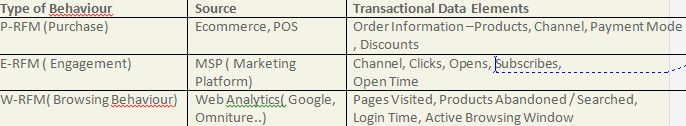
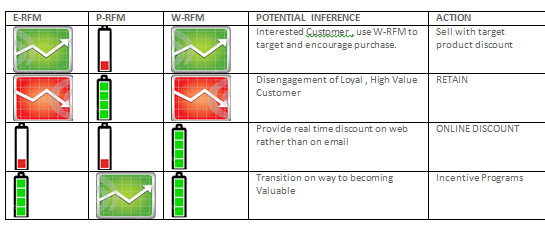
We will get back to our behavioral story around purchase and engagement behavior aggregation using RFM scores–We scored customers on a scale of 1to 5, derived from a clustering algorithm. One way of categorizing the clustering output could use a combination of Purchase and Engagement behavior as shown below.
Following the “Who will buy a computer” example, we can tweak the question to Who will potentially become a “Highly Engaged- Valuable” Customer or how customer demographic patterns impact customer behavioral scores.Following the “Who will buy a computer” example, we can tweak the question to Who will potentially become a “Highly Engaged- Valuable” Customer or how customer demographic patterns impact customer behavioral scores.

The figure above is a Classification model from a two year “simulated” data set of a grocery chain. The scores which are an aggregation of engagement & purchase behaviors are predicted based on the consumer’s location, gender and age. The decision tree spits out a set of rules that culminate in the pink boxes that denote the behavioral scores. Some rules that can be gleaned from this analysis are.
  • Florida -> Female -> Age <= 63 ->Category 3 -> Highly Engaged – Loyal Purchasers.
  • Tennesse -> Female -> Age >54 -> Category 4-> Semi- Engaged – Valuable Purchasers.
When we did the clustering using customer transactions, we got through to the first level definition of a customer ie Loyal – Engaged / Valuable- Semi Engaged etc. The second level of definition came in from the Decision Tree Algorithm that used demographic information and past purchase decisions ie aggregated behavior scores to spit out a series of rules. What we have really done is create a statistically determined segment or a customer persona. We can extend the customer Persona to a much more significant level of detail for eg like .“Female Middle Aged Tennesse Engaged and Highly Valuable”. If you plan on using Category RFM over normal RFM, you will be able to overlay product tendencies and develop highly targeted segments combining behavior , demographics and Product / Category orientation like “ Young Male from New York Upstate– Electronic Geek Highly Engaged & Loyal”. Well, the value of such a segment, computed algorithmically is clearly the capability to understand and map demographic and behavioral patterns and in the second case to help understand customer product tendencies and hence identify cross sell opportunities. Well, that’s the long and short of it- the algorithms that are popular in this space are C4.5 /C5.0/ Rpart / Random Forest ( Ensemble Models)..

8 - Analytics 101 for the Marketeer: Clustering and Customer Behavior(s)


Clustering is the task of grouping a set of objects so that objects in the same group are closer to each other and farther away from objects in another group. Well, now that the formal definition is through, we can get down to the brass and tacks – just replace the term objects in the definition with “customers “ and we’ll be on our way.
 Consider an e-tailer who wants to understand the age –locale spread of his customers. Ideally, he would need to process age first into buckets and then bring in the locale aspect of things to see something like this.
Clustering helps make the process and visualization simple and is a standardized package in most tools. There are different types of clustering like Partitioning, Hierarchical and Density based techniques though we will be focused on Partitioning techniques like C4.5 / K means methods. This technique assumes critical importance for two reasons:
  • Faceted behavioral Clustering - if you have objectivized different facets of behavior .. do check out my earlier post.
  • Clustering in itself lays the foundation for employing a host of other analytical methods in managing Customer Churn and Sales Uplift aka Cross & Up Sell. Taking the previous blog’s example of first party behavior ie Purchase, Engagement and Browsing, think of all the marketing strategies – you could drive given a basic customer classification like the following matrix. Remember, the following example is pure segmentation , not clustering.
    Let’s move this a stage up and look at a clustering model that provides an algorithmic grouping of similar customers , in this case purely Purchase Behavior. The algorithm has classified customers based on their purchase propensity, into five categories High Value, Loyal, Potential, Hibernators and Vanishers.
    The analysis is for two year in store data of a retail chain depicting purchase behaviour alone. The kind of personas ( The current analysis categorizes Loyal,Potential, Nascent etc) and segments you could drive are virtually endless based on your clustering parameters that fits your business model and consumers. I will try to bring in all the behaviors we talked about in earlier  posts - Eg "Young, Valuable,Engaged, Heavy Browsing, Electronic Geek" , "Mid Aged, Potential , Slightly Disengaged, Stationery Buyer" , so on and so forth. Some level of intelligent analysis is necessary to arrive at those critical consumer parameters that drive your business. But We'll never know unless we try, would we?

7 - A Data Modeller's Approach to Optimizing the Campaign Build


The Data Model per se, is a critical element in performance management not just for marketing platforms but any enterprise application that is data driven. No Surprise, that this is possibly the least focused on area on Marketing platforms. A detailed analysis of Marketing db structures is really out of scope here, but let it suffice to say that some MSPs have standard data models that they force fit for all marketers, some have a degree of flexibility while some are close to 100% customizable. The standing caveat  is that more abstract and flexible the platform higher the abstraction and lesser the performance of your marketing db -aka campaigns. Remember Spiderman ?? With great power comes great responsibility –meaning you and you alone are accountable for the design and performance of the monster you just created because the platform let you do so.
The data structures around an Email Marketing database need to cater to the four sources of data that are used across a Campaign Build Process as shown in Fig 4.

The four sources of information in the figure above need to be rationalized from a data design perspective in order to expedite the Campaign Build Process and there is generally a contextual trade off between normalization and using wide columns views. There is a plethora of areas available to tweak and rationalize the structures that can provide high returns. Some areas that that can directly benefit the campaign build process are listed below. Remember they are guidelines and you do need to have the capability to balance needs and use cases contextually to adopt an optimal design approach and be open to constant change. Do remember no db design in cast in stone. It will continually evolve as business, direction and customers change.The table below depicts a possible design approach for common use cases in a marketing repository.

Well, data modelling is an art and a science -designing a marketing database is no less a challenge. Being sensitive to how different marketing platforms structure your core CRM data elements gives a marketeer good control in preventing campaign performance issues and designing a scalable marketing engine.

6 - Operational Process to Tweaking the Campaign Build Process


Marketers need to comprehend that a cloud based marketing platform is enticing but shared across other customers of the ESP / MSP. If their campaigns have a performance problem, you can bet your boots that your holiday / week end campaign gets hit as well.The challenge of course, is in getting this context – MSPs may not share this information and degree of “Infrastructure Sharedness” too freely. After all, as a marketer, you subscribe to SLAs around the infrastructure not to a “labeled” marketing server itself.
 I will get a little technical here, since the context is important in understanding the overall challenges in managing first a marketing database and second on infrastructure like cloud based systems.Managing a fully functional Marketing database is a challenge primarily due to the usage patterns that it needs to cater to.   Some of the Use cases an email marketing database needs to exhibit are listed below.
  • Online Transaction Processing - for opt-in Management , preferences and Transactional Messaging.
  • Data WareHouse
    • Extract, Load and manage millions of demographic, and behavioral data
    • Manage and Utilize Campaign Results for segmentation and reporting.
    • Merge and Query Massive data sets for Effective Targeting.
  • Reporting
  • Data exports on campaign efficiencies and ROI.
  • Campaign Trends & Response Variance Analytics. A primary area where the use cases seem contra-indicatory are Data Load Jobs and Campaign Launches. Both are business critical, time sensitive and contra-indicatory–one being a bulk data import and the other a data crunching background process. Scheduling Campaign Launches and Load Jobs appropriately is critical since both processes tend to use the same database resources / objects and can quickly tie each other down creating dead lock scenarios depending on the underlying technology.It is important to correlate these adjunct activities from frequency, intensity and duration perspectives in order to predict and manage system load. The following days in life chart depicts the contention that a typical Marketing database goes through.
  • A Scheduling Perspective
    The Red colored dots indicate the times of the day when concurrent jobs and campaigns could potentially come into conflict. This information by itself is only an indicator since intensity or the load on these jobs / campaigns is still not evident.
  • An Intensity Perspective:The following graph Fig 3 is a more analytical report which combines the schedule with the average time consumed for the launch or load job. The X axis indicates the Job / Campaign identifiers and the Y axis the schedule. The intensity is of the process is indicated by the length of the execution process as the average duration of the load or campaign process over the last 30 days.           This kind of “Contention Analysis” is highly useful tool in deciding operational strategy, System House keeping ,maintenance requirements and ultimately managing campaign performance
The key to operational control is optimizing Campaign Schedules and Data Processing jobs in such a way as to reduce stress on a common infrastructure. Remember, spread it thin, keep it simple and Keep watching. What is watched.. Improves!!

5 - Campaign Build Process in Marketing Platforms


Cross Channel Marketing Delivery focuses on four primary functions– Creative ,Integration, Delivery and Analytics. Integration is the broad term used to describe data processing and scrubbing functions while Delivery involves Data Segmentation, Personalization and the campaign build process –happening predominantly on the marketing platform. The delivery process hogs database resources and can potentially render the system too slow for other contenders like online subscriptions, data loads and reporting. Marketers need to manage the Campaign Build process effectively to ensure predictable campaign delivery, high availability to competing processes and in case of SAS based platforms – direct Customer Satisfaction. Even though performance of the build process is a core function of the Marketing platform, a “end user” awareness always helps. The efficiency of the Campaign Build Process can be enhanced by three primary factors..
1) Technical : Managing the Build Process external to the e-Marketing ecosystem.This is really a “Platform” feature and marketeers generally have little control over this aspect.
2)Operational : Identification and Contention Management amongst competing processes.
3) Design : Database Design & Structural Rationalization.
Introduction : The Campaign Build Process and the Levers:
The high level process is a 3 step breakdown.
  1. Query the Customer database based on the Segmentation Rules
  2. Execute Personalization rules set up by the Marketer.
  3. Merge Content ( Static & Dynamic) from the asset library / CMS.
A detailed WORK FLOW of the campaign build process is depicted below.

4 - Bootstrappng for the Marketer - Quick and Dirty


Before getting onboard a Phd in Data Mining or maybe acquiring one, there is some level of magic a marketer can do with the behavioural database he has set up, without the need for advanced analytical Tools. These are quick and dirty methods but can boost conversions, reduce blast volume and in general power up your marketing efforts with much needed “customer centric” intelligence. Some basic knowledge of SQL can help though it is not mandatory. You can experiment with the following scenarios and make the lord and master look up and take notice. Of course, the basic assumption is that R, F and M scores are computed on a frequent basis and a history of these metrics over time are maintained in a database.
1) Using Latency to Predict the next Purchase Date for the customer.

    a.  Use the current  R (recency)  value ( in days), and add it to the last purchase date of the customer to predict  the probable purchase date.
    b.    Use Current Category R Values ( R computed at Product Category level ) for a customer, add it to the last purchased date of the respective category
  to predict the probable purchase date for a particular category.
   c.   Use a running average of Recency Values for a particular category or customer to fine tune the computation.

All that is  required is to schedule campaign launches for respective categories and customer combinations on these dates and viola…you are on your way to kick starting your  first predictive marketing campaign on it’s way.

2)Cross Sell: Using Product Affinity  / Market Basket Analysis :Consider your simple transactional database, a stock register of customers and items purchased.  This contains customerid, Transaction Date and items purchased.
Customer    Tran Date    Item1    Item2    Item3    Item4
C1                  XX              Pa         Pb      
C1                  YY              Pc         Pd      
C2                  XX              Pa         Pc     Pb  
C3                  YY              Pc         Pd     Pa  
C4                  XX              Pa         Pb     Pc            Pd
Create a Simple Matrix like the one given below that indicates the no. of times Pa is purchased along with Pb , Pc, Pd. That divided by the total number of
 transactions ie 5 gives a ratio of mot preferred group of products. This is the most elementary form of Market Basket Analysis
    Pa    Pb U Pa     Pc U Pa            Pd U Pa
Pa        3 / 5 =0.6    3 / 5 =0.6         2 / 5= 0.4
Well, there are additional aspects to the whole process like  Lift, Support and Confidence that give more statistical insight but hey, the conclusions for a
rookie are’nt so bad. We did find out  that as a combination, ( Pb  and Pa ) and ( Pc and Pa) occur frequently enough. Get the guys who have purchased only
Pa , try Pb or Pc as Cross Sell Options before moving on to more advanced  concepts using Lift and Confidence measures. Some quick Tips...
  • Use Purchase Dates: To ensure you don’t go back too long in time and use product combinations that are’nt really happening now, either disregard transactions older than a
  • particular date or allocate a smaller weightage for older product combinations. You really have to decide how old really is “old”.!!
  • Use Lift & Confidence Measures. (if you got your Phd)
  • Use Latency: Once you hit on a cross sell product  to a customer using the Magic Matrix, use his Recency data described in section 1 to hit on the optimal timing  of the campaign.A hybrid approach, using multifaceted data to hit on the relevant and timely messaging.Well,  was’nt that good !! We managed Relevancy – through the right product to  cross sell and timing using the Recency Data of the customer.
3)Retention : Winning back Fading Customers :
In General , Engagement data, as in response to marketing communication is a much earlier indicator of customer disinterest than Purchase behavior
itself.  Purchase scores or P-RFMs fall much slower than E-RFMs or Engagement RFM scores. A SMART trigger to capture a free fall in E-RFM say from 4.5 to 3 can quickly give the marketer an early indicator of disengagement giving  him the
additional time required to retain the customer vis a vis a reaction that happens when the anticipated “nxt purchase” does not kick in.These three use cases are by no means “end-all” but significant business scenarios that can provide solid value to a marketer helping him in
Retention & Sales UpLift. Happy Mining !!!

3 - SMART RFM - Strategizing and Consolidating Consumer Behaviour

There are three internal sources of behavioral data that marketers can use to drive engagement. The interplay between these varied sources and a combinatorial approach can drive interesting and highly practical engagement strategies.
Most marketers have ready access to the following sources of transactional information.These sources of data can be aggregated and used in isolation or together to handle live situations and drive positive customer engagement.

Retention for eg can be driven by measuring sudden drop in E-RFM and the relevant strategy directed by P-RFM. A sudden drop in E-RFM indicates a disinterest or lack of satisfaction that marketers can tackle better on a “point in time” basis rather than post facto. This really points to a potential future drop in P-RFM indicating that you could lose the customer. Obviously , a marketer would treat a valued customer’s engagement drop very differently from a first time consumers’ . Some interesting use cases have been listed below to indicate the interplay of data elements and how marketers can take advantage of subtle changes in behavior to acquire, improve sales uplift and retain customers.

This approach increases relevancy and timing of the marketer’s communication and positively impacts conversion –since every communication is based on context rather than a “universal” approach.
One last note about C-RFM ( Category – RFM). Employing C-RFM gives much better insights on customer product orientation and can drive better targeted marketing over P-RFM. It is a marketer’ s call – and in general, a diverse product mix across value, utility and consumption pattern leans heavily in favor of C-RFM while P-RFM resonates better with a flat product mix.

2 - RFM can misbehave and here’s why – Part 1


Having got through the data wiring aspects of connecting real time transactions into the
repository, it is tempting  for Marketers to put in a Customer Value indicator in place – something like the RFM model.   This can give tangible quick wins like
1)    Easy Customer segmentation.
2)    Formulation of a Customer specific Engagement Strategy.
RFM really is a context sensitive framework and is most effective when the computational  dynamics and interpretation are mapped to business realities.

Computation: RFM can be computed using value or median based methods. Median based approaches are simple. They order customers based on say Recency, frequency or monetary [VR2] value and allocate the ranks for each quantile . They really force an equal number of customers in each “rank”.
Value based approaches are slightly more evolved and they rank the unique  values for example, the total purchase value and allocate the customers having the top 20% values as 1, the next 20% as 2 and so on.

Median Based Approach
Value Based Approach
Computation
Rank  All & Split
Rank Unique and Split  
Distribution
Uniform
Staggered
Repeatability
Inconsistent
Consistent
Interpretation
Uniformity
Outliers

Interpretation: For instance, a customer having a preference to  high value products and purchasing at a lower average frequency, will possibly be ranked at the bottom of the pile when compared to the rest of the population. RFM assumes that the driving need for buying behavior is innately similar and that can lead to a “one size fits all” approach – aka disaster.
Another instance where RFM simply cannot help is with new customers . Since RFM needs demonstrable, recorded transactions, it will by default categorize fresh  and new acquisitions customers at the bottom of the pile until they work their way up the rankings – which could result in marketeers  not encouraging  new customers to move up the value chain if RFM is a critical piece of your marketing strategy.

Weightages :  RFM considers  each of the R,F and M as equally important ie a weightage factor of 1 each. Though it is  simple enough to allocate relative weights for each of these dimensions,
Marketers can struggle to find out the  optimal combination of weightages that fits the business and represents reality. The only way really is to continuously  tweak  different weightages [VR3] and closely monitor marketing ROI.

It’s not All Bad !!  However, There are other avenues to improve RFM efficiency  like considering additional behavioural aspects to supplement purchase behavior and using Product Affinities to drive RFM Analysis that can yield much better results.


 [VR1]Misbehave attracts attention but I thought it is a strong word  - Can we use ‘Misfire’ instead?
Deliberate use to attract attention

 [VR2]Recency, Frequency & Monetary values. Done

 [VR3]Should it be mentioned – ‘Recency’ is usually the King. Am tralking theory though in practice recency is a more serious indicator

1 - Three Baby steps to “Jump Start a “Behavioral Marketing Database”


We all Know Why  : Given the need to focus on relevant, timely messaging to customers, it has become imperative for marketers to have access to real time customer data. The data drill down to “timely & relevant” are multi faceted  behaviours  translating to different sources– Purchase, search, browse and abandonment from ecommerce, returns and logistics from ERP,  Engagement or Campaign Stats from ESPS and  Reviews & “Customer Speak” from Social & Speak Out portals.
 
Identify Critical Behavioural  Sources:
It’s really not rocket science nor does it need a significant IT Outlay but it is imperative to cut through the cackle and focus on those areas that
1)    Provide Maximum value
2)    Are easily Accessible
3)    Quick to integrate with
4)    Provide quick behavioural insights.
The two data sources that naturally suggest  themselves  to an e-tailer are  
1)    Ecommerce Systems  - If you are already on a licensed platform like Big Commerce, Magento or ATG,  you are half way there.
2)    Marketing Platforms-  for Engagement and Channel Behaviour. Most of the mature platforms expose data export mechanisms to quickly integrate with.

I know and hence I can:
Now that the sources are identified it is a simple matter of hooking up these real time data sources to a data structure and making it available on line for the marketing team to play with. The icing on the cake is Bingo … “ Real Time!!”.  Cutting to the chase,  the three steps to the Behavioral Grail are
1)    Identify & Hook up the Integration points across Ecommerce & MSP Systems.
2)    Push accumulated data into a standard marketing repository.
3)    Aggregate the data into Customer KPIs like RFM, LTV etc  using pre built algorithms.

To get a start on your data driven, customer centric journey, these building blocks can quickly be assembled to provide the  initial adrenalin to your marketing efforts, paving the way for serious focus on marketing strategy  & planning.