Thursday, May 24, 2018

22 - The Cost of Free: Open Source or Enterprise Commerce ?


When I moved to the software industry as a programmer from the petrochemical field, I needed to step up .. and fast , having neither the qualifications nor the experience in programming. I took the obvious route of training myself at home with a home PC. The nerdy dream of setting up my own system and flooding it with the then “hot” tools was too enticing to pass up.

I did what most learners do – popped down to the grey market with my first month’s pay check and blew it on the latest DDR RAMs, Scuzzy hard drives, anti glare / stress free monitors, and what not: Added a couple of S/W CDs – OS , Latest IDEs, enterprise Database S/W ( all from the same grey market to boot) and went home tired but happy. Savings ??? I spent less than 40% of the moolah I would have doles out on a branded desktop and software. Little did I know what I was in for.
It took me close to a day to assemble the stuff ( I had no degree in H/W, come to think of it none in S/W as well), another day or two to get the OS , DB and IDEs up and running to get to my “Hello World”. Viola tout – time to get to the serious stuff now.
 It started after a couple of weeks and I experienced this over the year – the DDR Stuff didn’t sit too well in it’s slot – a tap and scrape with a screw driver solved this, the monitor showed lines, the dog chewed up the cables and I could’nt get a “genuine fake” replacement, Windows popped with a message every two minutes that it suspected a fake edition, the database crashed and the installation CD wouldn’t work.. My progress on the “Nerd Goal”.. ….Zilch!! All my efforts were focused on solving the inanities of the Hardware and / or the Software, not so much on the process of writing, rewriting, white box testing and optimizing the lines of code that every programmer must go through. Looking back, maybe it was not all that bad – I was after all trying to supplement my learning and some body hear me – I SAVED 60% -even if I chucked the monster in a year.

I sell enterprise commerce platforms for my daily plate of rice, dal and vegetables ( boiled not fried) and this is a story I share with my prospects when it comes to a discussion on Why chose Enterprise over freeware? I call it the Cost of Free. Take a look at the comparative cost items for an assembled grey market, free ware based desktop vs a branded one which I purchased later on.


Well, seems like the Grey Market won by about twenty grand right?? Wrong !! Think again. I chucked Option A in a year but then bought Option B ( I got a promotion !!) that ran like a charm for the next 4 years. Well, understanding the Cost of free came at a price and a startling realization, that a product could be more pricey than it’s competitor but could end up costing you lesser, not to mention all the frustration and angst that goes sleeping with a product like Option A. As you can see below, Option B won by a mile over a four period, two point five, if you add the copious amount of sweat and toil I was spared.


The story of Enterprise Ecommerce platforms vis a vis Free / low end ware is pretty much similar -only the stakes are way higher as you can imagine. Running an online business is not the equivalent of learning to code and this is a lesson most merchants learn and at an expense. As an online practioner, you own the online revenue and your focus is to acquire, engage, retain customers and generate a predictable revenue stream through the platform - not to scout for odds and ends ( read extensions and modules) to make the platform execute the 101s of classical eCommerce. Think about it – freeware gives you the 3Cs you need for online commerce – Content, Cart and Catalogue capabilities. Enterprise versions come with additional capabilities that accentuate your top line using the 3 Ps - Performance, Personalization & Persistence (Loyalty). I ask again, what are you concerned about “The Price” or “The Cost” ?

21 - Personalizing Ecommerce Search using Logit and Gradient Boosting.


You run the P/L for an Ecommerce business - Innovation is your raison d’etre, bleeding edge technology, the bastion of your business and Data your lifeline.
 ·      How would it be If you could re-rank your site search Results based on Relevance of a Page?
 ·      How would it be If you could provide the top 10 URLs that a user is most likely to click based on a query term?
·      How would it be if you could extend this concept and employ personalization at scale so that search results and the ranking thereof is based on individual preferences?
 ·      What would this do to your conversions?
Great Marketing empowerment no doubt, but before delving into the details, let’s get the 101s in order.
 1)    Relevance: Denotes the actual score for the result page based on various factors. Pages are ranked based on the scores.
2)    Attributes: The Factors or Independent Variables that impact the final rank of the URL.
3)    Algorithm: A fancy term for the ranking process. Can be as simple as a thumb rule or a Lambda Mart Gradient Boosting process. ( Pretty Impressive eh?). For non nerds like myself, it is a formula that spits out the relevance of the page based on the page attributes provided.
4)    Query: The unique search term input by the user.
On a side note, the term Relevance is, to put it mildly, insidious. I spent weeks trying to get my arms around the two major data sets that impact relevance. Did I say I am not an AI nerd?? The two disparate data sets impacting Relevance are A- Page related and B- Web Log related. Part A is more of metadata and indexed information while Part B is more dynamic.
A: Page Metadata:
a.    Body Hits: Positioning of the search term within the document
b.    Body Length: No of occurrences of the term within the document.
c.     Anchors: No. of links with search terms within the document,
Good news is that most modern search frameworks like Lucene and by extension Elastic Search, Endeca and so on do this out of the box by indexing existing and new pages on the header, content, Anchors, meta tags etc.
B: Web Log: As the saying goes, Data est le pétrole noveau…and web logs are gold mines make no doubt about it– if you know how to read through and effectively employ the insights. For instance, web logs give you the following (**This is not an all-encompassing list though).
a)   Who has logged in and when? – Session Information
b)   What did they search for? – Query Term and Sub Terms
c)   What results were thrown up? Search Output
d)   What did they click through? Clicks, Misses and Skips
e)   How long did users spend on a particular page? Dwell Time.
The nugget in the whole piece is point d). Imagine a user issuing a query Q and the search engine spitting out URLs U1, U2, U3, U4 and U5 as the results in that order. Assume that the user clicks U3 and U4 in the browse process. The implications are the following
1)   U1 and U2 are SKIPS and need to be penalized because they got passed over by the user even though they were ranked 1 and 2 by the search engine.
2)   U5 is a MISS - even though it was visible on the page the user was gratified by U3 and U4 and did not bother to check out U5 further below. That’s a negative for U5 but not as bad as the previous case (1).
3)   U3 and U4 are CLICKS – successes but again their relevance to the user’s expectations depend on the “DWELL TIME” of each URL. If the user spent 30 seconds on U3 and only 2 seconds on U4, obviously U3 is more relevant to the user than U4 and if this happens across all users significantly, U3 always needs to have a higher rank than U4 for the named query.
The Framework : Given the information on the web logs, the following 5 part framework will be useful in implementing a web log based re-ranking plug in to your ecommerce search capabilities.
  •  Input Variables: Collate input variables from web log – they will include at the very minimum –user , session, query terms, CLICKS, SKIPS,MISSES, DWELL TIME, ORIGINAL RANK etc. The actual scope of the aggregation techniques required to metricize this information this is beyond the scope of this article.
  • Output Variable: The output any formula or statistical / AI Model you employ is the probability of the particular URL being relevant to the query– generally on a three point scale. In Simple Naïve Bayes terms, we are trying to predict.  Probability  ( Relevancy = HIGH / Given Input factors in Step 1 )
  • Algorithms: The Math around each of these approaches is certainly beyond this article and as a confession beyond the author as well.
    •  Point Wise Classification : Eg Naïve Bayes, Logit – Rank URLs by descending probability of an URL’s relevance being HIGH and / or MEDIUM.
    •    Pair Wise Classification : Eg Gradient Boosting, Lambda Mart – is a multi level measure that works on comparative cost of ranking one URL over the other across the complete pair wise URL combinations for a query.
  •  Re Ranking Efficacy:  NDCG (Net Discounted Cumulative Gain) is a measure of the Information Gain obtained by a particular ordering of URLs and their eventual relevance to the query posed. Simply put,  Higher the NDCG, better the information gain and that’s exactly what the algorithms seek to optimize.
  • Personalization  & CX:  For IT  Mature Organizations focused on Customer Centricity, employing Search Re-ranking and relevance, based on individual click history brings a wealth of personalization opportunities and behavioral context to user browsing actions.. all this at real time.

20 - Was James Moriarty the best CMO Ever?


“He is the Napoleon of crime, Watson. He is the organizer of half that is evil and of nearly all that is undetected in this great city, He is a genius, a philosopher, an abstract thinker. He has a brain of the first order. He sits motionless, like a spider in the center of its web, but that web has a thousand radiations, and he knows well every quiver of each of them..”

Now hold on…not for a minute am I suggesting that CMOs follow the nefarious actions of the fictitious master criminal but there are parallels between how Conan Doyle visualized Moriarty running his underground organization and the expectations stacked up against modern marketers. Before we get into that, Moriarty had an absolutely unique position in the annals of crime – he was -A criminal consultant much like Sherlock himself –the world’s first consulting detective. Like Holmes expounds Moriarty’s role–“He does little himself. He only plans.”

 Now to the common traits between the fictitious criminal master mind’s organization and a Modern marketing organization. Moriarty was an assignment based consultant – a Napoleon of crime.

1) He delivered the blue print for the “finalized approach” –(pun intended) to execute an assignment –end to end. –“.First he would content himself by using his machinery in order to find their victim. Then he would indicate how the matter might be treated. Finally, when he read in the reports of the failure of this agent, he would step in himself with a master touch. “ –The Valley of Fear - Think Customer Lifecycle.

2)He allocated, hand picked the right tools, people and skills to bring the assignment to closure.-“Ha! It came like that, did it?” said Holmes, thoughtfully. “Well, I've no doubt it was well stage-managed. There is a master hand here. It is no case of sawed-off shot-guns and clumsy six-shooters. You can tell an old master by the sweep of his brush. I can tell a Moriarty when I see one. .” –The Valley of Fear. 
 Think Mature Marketing Technology, Cross Channel and Personalization.

3)He innovated constantly -“The old shikari’s nerves have not lost their steadiness nor his eyes their keenness. A soft revolver bullet, as you perceive, Watson. There’s genius in that, for who would expect to find such a thing fired from an air-gun.” Adventure of the Empty House. Think Send Time Optimization, Geo Fencing and Predictive marketing.

4)He always knew where and how to get to his target.-"You will get no worse than your deserts from      that, Mr. Douglas. But I would ask you how did this man know that you lived here, or how to get into your house, or where to hide to get you?” The Tragedy at BirlStone. Think Behavioural Targeting & Omni Channel.

5)Finally, a word about Mycroft Holmes “The conclusions of every department are passed to him, and   he is the central exchange, the clearinghouse, which makes out the balance. All other men are specialists, but his specialism is omniscience.” –The Adventure of the Bruce-Partington Plans. Think Integrating Brands and Business Strategy across Sales, Service and Operations.

In summary, the CMO is now a C-Suite operator who is responsible for corporate customer interactions across myriad functions and direct the ebb, flow, context and relevancy of those responses.

19 - STT(Send Time Testing)…The whole Shebang


STT  is the prelude to STO – the process that ensures the STO algorithm has an unbiased data set to do it’s predictive magic. This process reduces the impact of two challenges that STO algorithms face – how significantly depends on how long you are willing to run the test as a marketer – it is dependent on your Business and campaign cadences. But for a set up where 3-6 touch points per customer per month is the norm, One month is quite short and anything beyond 6 might not show appreciable bang for the buck.

Challenge #1) Uniformity is Engagement Touch Points. If all your campaigns are scheduled on a week day at 5 pm, you can identify good respondents but you do not know if they will actually be better respondents on a different schedule. Similarly, you can identify the poor respondents but you never know if this is their best or worst phase unless you target them at different cadences.

Challenge#2) Seasonal Fluctuations: We all consciously or unconsciously shift online behavior that might really be there to stay or could be an adhoc aberration. As a marketer, the capability to detect this anomaly and quickly conclude the transient nature of this change is key to understanding behavior.
Let’s see how to set this up on Marketing Automation Platform. It is good to state the objective of the exercise (and for simplicity’s sake, look at three facets of information) and the best way is to use the “I want to methodology”.
 Objective: I need to understand the Email open behavior of my customers. I want to know
What is the right Slot  to target a customer every day in the week?
 What is the best day in the week to target a customer and in what Slot?
 The following table will help you dig in to the details. Do note that we can get as granular to the hour that we want to but that really means more testing, more time and yes you are right – more Money.

Well, now that’s off the table, the next step is to dive down into the nuts and bolts of the implementation. You do need to have a clear process that will start kicking from the instant a customer is subscribed to your mailing list, take him through the life cycle of the test and finally push the results for this customer to the STO Engine. Post this process, the customer is “Stabilized” which means you have a clear grasp of his / hers  “Open” Preferences and can target them appropriately. A caveat however, is that you need to monitor this with an Audit Mechanism, and watch out for “Anomalies” IE changes in behavioral patterns.
The following workflow describes the logic at the heart of STT. There are several ways to skin this from an implementation standpoint – using back end architecture and complex ETLs / schedulers or if you are on advanced platform, do utilize the Life cycle Orchestration features that should make life simpler and reduce dependency on IT resources.

Well, there’s that and you have upped the ante with one level of customer centricity vis a vis your engagement goals. This kind of “Tune Up” can go a long way in improving your Customer Satisfaction, Open / CTRs, revenue and yes, your goals as a Modern Marketer. If you would like to know why STT, here is the link to my previous article. STO is Wonderful but have you done your STT

18 - STO is wonderful – but have you done your STT? (Send Time Testing)


Campaign Send Time Optimization does produce remarkable results .. MSPs today claim to have an innate feature of exploiting typical customer open / click timings to schedule critical Promotional programs. While some look at a brand specific campaign events, other MSPs use  the learnings across the plethora of brands using their platform  and offer an aggregated, verticalized  campaign scheduling out of the box. For eg, banking and financial services customers in a particular demography and even political affiliation, tend to have a higher mode of email opens between 8 and 10 am on week ends and between 6 am and 7 am on weekdays. Simple..yet amazing feature that can drive CTRs big time.
 But most of these features are post facto – they analyse, slice and dice optimal open / click through Timings based on Customer Email behaviour.  What does’nt seem too right about this process is that
  • There’s no testing –The web optimization guys got it right – Test & Target.
  • There is no accounting for seasonal fluctuations of opens and clicks.
 Here’s a list of the top grand Slam singles players of all time. Well Roger is no:1 and that’s a no brainer. I don’t see Becker anywhere in this list- in fact he has’nt completed a grand slam – The French Open and RG has always negated his style.

Anyways, are your customers grand slammers or are they pure grass court demons –like Becker? Well,you don’t really know unless they have played in each tournament. Here’s my point.. Look at a simple four zone split - Morning, Afternoon, Evening, Night  across which customers are categorized. STO provides a neat output like the following post analysing the open and click times across all customers.

Makes sense right? But look at the columns with 0% on it. How are we so sure John has been equally  targeted across Morning, Afternoon, Evening and Night for you to make a decision that the ideal open time  is Morning? John has received 20 campaigns in all – 16 at night time, he has opened three and just four campaigns  in the morning zone - he has opened two out of those.
 The interesting questions that pop up are
  • How are we so confident that Morning emails work for John?
  • How do we automate the process of testing for the right slot without bombarding John with emails?
  • How can we systematically test John’s responses equally across zones so that we understand his preferences?
  • How can we shorten this prediction cycle and get to the optimized zone as quickly as possible?
  • John is a runner and gets outdoors during summer pretty early – catches up with emails quite early in the morning. During winter he seldom opens emails before evening. How do we keep up with these behavioural changes?
We’ll get you answers in the next post and meanwhile here’s my link to the “ Bare Bones” STO article. Bare Bones STO

17 - Karmic Cycle of IT Services –Transmute or Perish


This is certainly not the spirituality around “What goes around comes around” theory but maybe IT especially the IT services industry is at a point of inflexion. There has been enormous transformation over time, but maybe it is time to transmogrify. The service portfolios have been broadly as depicted below starting from Infrastructure management, App Development / Support, Enterprise Applications, Product Implementation and Business / Technology Consulting

, the span of each block indicating the potential volume of business and height indicating the cost these services come at. Interestingly, traditionally consulting companies have come down the volume curve opting to set up captives while IMS, ADMS companies have dabbled in consulting and product management as shown below searching for the sweet spot where Value can co-exist with Volume. Well, this has gone ahead and created a plethora of delivery models starting from Onsite, Hybrid, Extreme off shore, near shore –we’ve seen it all though in all fairness to the industry, Space and Water are yet to be explored !!


Entrez La “ IT Services Salesman”: A good indicator of what IT Customers look for in a vendor is the SALES KIT salesmen lug around. They sold skills, they sold scale, they sold processes, they sold compliance and governance, they sold lower costs with an overdose of juxta positioned jargon, the whole thing stank to high heaven –but hey, the stuff worked . Well think again buddy, while we are Evolving from state A to B, customers are choosing disruption as the means to growth –aka innovation, speed, agility. A client of mine put it so well in just two lines:
  • Can you Solve my Problem with a Nimble two-pizza team (size that’s right for two large pizzas).
  • Can you Give me More for Same today and More for Less next year?
Well, one thing that’s not going to change is the fact that IT is literally transmogrifying at real time pace be it development, testing or deployment frameworks. Here’s a quick comparison of what IT Services were , maybe still are in many places and where the smart ones are headed to.


IT Services based organizations have the opportunity to gain domain knowledge over repetitive engagements with customers – Health Care, BFSI , Automotive etc. With each engagement and each domain specific deliverable, organizational internal confidence goes up. The smart ones abstract this knowledge to focus on one or two industry specific problems and call it a “Vertical Solution”.
Solution: A solution is what it is a theoretical answer to a practical challenge in a specific vertical, credibility coming from the deep domain expertise garnered through a powerful customer portfolio. Sounds like an easy sell?
 Advantage to customer: 50% off on Discovery and Design Effort. 10-20% lower cost on overall cost. Time to Market.

Frameworks: The smarter ones go one step further and build reusable components – physical software components that can be plugged together like pieces of a puzzle with critical components built on demand. Advantage to Customer: 30- 50% cost savings on cost & time to market.

Products : Probably the final leg of the journey where the organization feels that the solution and the frameworks have reached a point of maturity with repeated implementations that the whole concept can be commoditized. Advantage to Customer: I think the advantages to a customer is obvious but the kind of credibility and branding that the vendor gets is an icing on the cake. Of course, this approach is really not as hunky dory as it seems.

Organizations especially service industries do need to answer tough questions and do some deep soul searching to get to first base. Some questions that can put organizations on the way are
* Do we have deep expertise in the functional area?
* Have we identified a pattern – a similarity of challenges in the industry?
* Does solving the problem matter to some one? Who is it?
* Do we have the risk appetite to invest in product development and most importantly got market strategy?
* How many such initiatives can we encourage and develop as an organization and do we have the mind share to achieve this?
* How do we have a nice blend of skill dependent IT services complemented by niche, verticalized solutions or frameworks? Can products and services co-exist?
* What kind of change management is necessary to run such an organization in terms of innvovation, People policies, management skills etc?

16 - Is E-Commerce fast becoming a subset of Digital Marketing?


Well, as I was working through some post purchase engagement programs for a customer, a ludicrous thought struck me.. What happens if you try to explain the difference between a email campaign and a Ecommerce application to a marketing manager who just woke up after a 15 year coma –let’s say the dot com bubble was the last IT disruption he experienced? The person trying to provide enlightenment has my best wishes and no – I would’nt want his job. The guy most probably will come unstuck!!

Let's look at this purely from what the customer sees –yes ..yes and yes …I said “sees” as in visually engagement and not from a holistic consumer experience. The working components of a marketing message in no particular order of priority, goes this way in my opinion , give or take a few.


Looking at this infographic, it is almost impossible to say if this kind of engagement or solicitation to buy is happening over a web site, a mobile or a plain old Email –maybe this framework works for a “Physical flyer” too.
The only difference is that the tools for rendering each of these facets are radically altered if you consider this happening in an Ecommerce system or a simple promotional campaign. E-commerce systems of course, come with more capability on live engagement like chat and support services that are possible since the whole experience is at real time. In my experiences, implementing and building engagement platforms across Digital Commerce, Marketing, Personalization Engines and DMPs I have the seen four critical changes over the years that make the subject line of this post line closer to truth maybe even inevitable in the near future. Every one of these features I have listed are “hand crafted” sophisticated add–ons that needed a crack technology team to build and manage even as early as 5 - 6 years ago.

Product Design: Over the years, E-commerce products have moved on tremendously in terms of features – they are no more a collection of dynamic product pages backed by a simplistic inventory system. They are bundled in with capabilities aka “ Business Usable” capabilities to manage
  1. Content – Dynamic and Personalized
  2. Look & Feel
  3. Promotions – Product, Customer, Category Levels.                            
External Functionality: E-commerce Integrations
The caption sounds technical but really the today’s e-commerce ecosystem does come with add on subscription products to achieve the following and much more. Some typical on demand features are around.
  1. Payment & Tax Management.
  2. Logistics and SCM.
  3. Product Recommendations & Ad Management.
  4. Anonymous User Identification & Tracking
  5. Advanced Search capabilities & Transactional Messaging.
 Cloud: The Great Leveller: Well, all the features listed above do need a strong IT team to keep the engine chugging but the combination of an Ecommerce Application in collusion with a hosted infrastructure –is probably the biggest technology disrupter ever. An e-Tailer or a retailer with aspirations to sell online can get onto the online band wagon for as low a subscription as 30$ USD per month and walk out a month later if things don't work out - sans a dent in his pocket.

 New Kid on the block: The CMTO: A new breed of techno-marketing professionals are taking over –some of them coming through with a deep IT back ground with an added stint in product or retail marketing and still others more from the old school but quickly catching up on best in class technology concepts. In a Nutshell, they understand both worlds and come with the right balance of creative, customer engagement, marketing, selling and technology skills – and they are ready to take on the numbers as well !!

Reorganization : The fourth factor is today maybe recondite, but some organizations especially ones that look ahead are internally reorganizing to suit the changing ecosystem. We do see new leadership roles in Digital Business – the portfolio mandated to managing Global Digital Footprint for the brand – be it digital,multichannel or omni channel engagement, customer centricity, online selling via first party or resellers and in a nutshell manage P & L for online sales –B2B or B2C.

15 - Analytics 101 for the Marketeer- Modeling :The Balancing Act

Add caption

I will digress a bit here to reiterate the Pooling aspect of the framework specifically the data model –I do see that as a “LPHV” ( Lowly Prioritized High Value) Item. There are three fundamental modes of managing data and processes between in house CRMs and external marketing platforms unless of course, you are Amazon and have your internal campaign management & marketing platforms. The data model is pivotal to every integration, Plug and Play solution to deploy to enhance your marketing automation.
  1. Segmentation intelligence on an external tool and ESP functioning as a Plain Jane cross channel “blasting engine” .
  2. ESP hosting transactional and aggregated information for segmentation and personalization.
  3. A hybrid mode incorporating a bit of Options 1 and 2.
 The decision around these options are critical and will certainly influence campaign performance, scalability and a marketeer’s capability to bolt on analytical solutions on to the platform like Send Time Optimization (STO), Behavioral Clustering, Market Basket Analysis ( MBA) and so on. Well, all the arrows in the quiver may in reality be “un-deployable” if a sub optimal approach is chosen, leaving a stunted data mart in place.Here are some of the information elements that a typical first degree database typically holds.


Managing a fully functional Marketing database is a challenge primarily due to the usage patterns that it needs to cater to.    Some of the Use cases a cross channel marketing database needs to exhibit are.
  • Online Transaction Processing - for opt-in Management , preferences and Transactional Messaging.
  • Data WareHouse
    • Extract, Load and manage millions of demographic, transactional and behavioral data
    • Manage and Effectively Utilize Event Data for segmentation and reporting.
    • Merge and Query Massive data sets for Effective Targeting.
  • Reporting -Campaign Stats & Trends
 The four sources of information need to rationalized from a data design perspective in order to expedite the Campaign Build Process and there is generally a contextual trade off between normalization and using wide columns views. There is a plethora of areas available to tweak and rationalize the structures that can provide high returns. Some areas that that can directly benefit the campaign build process are listed below.

14 - Analytics 101 for the Marketeer. Spot & Pool in the SPIRAL Framework


A framework is generally directional in nature and the nitty-gritties of the individual phases are the critical components for ensuring outcomes. I will go through some considerations that marketeers need to keep in mind to manage the S & P phases of the SPIRAL approach while putting your data driven customer-centric approach on track.
S: Spot & Identify “Marketing Aligned” Consumer Information.
P: Pool and manage multiple Data Sources into a single storehouse.
The S & P are probably the most crucial aspects of the methodology since they are really the bread board or the foundation over which the rest of the circuitry can be wired on. The depth to which you get to in designing and thinking through the “SPOT” & “POOL” phases sets the direction in terms of the data elements that are critical to you and how they are structured together as a conceptual data model. Slightly technical aspects, but simple enough when spitballed with a data analyst. Your business acumen and the data analyst's tools need to collaborate for success.

 The "Spotting" Phenomenon:

The infographic above depicts the behavioural aspects of a consumer business that could be of potential interest to a marketer in a consumer scenario. I have taken the liberty of drilling down  into some of the data elements that make up a particular behavior. Some of these are perhaps less pertinent to your business , there are probably others that impact marketing efforts more significantly. The data elements need to be carefully traded off based on the business value each step can bring in vis a vis the investment that is required to get these in place.
It is good to think through the following questions before getting a particular data element on board.
 Where does this data flow in from and why is it important to me?
How can we store it so that it can be accessed on a regular basis?
How can we get to this data at real time?
What is the aggregation mechanism to build intelligence on this data?
How do we effectively use this to “power” our marketing message with relevance and timing?
How does the interplay of different behaviours matter to my business and what does it tell me about a consumer’s mindset?
How do we use this intelligence to be proactive about our marketing efforts?

The "P"OOLING Phase:

Having identified the ways and means of getting the individual data elements in place, the next step is the P or the Pooling phase. The structure in which the data resides is key and the following considerations need to kept in mind while designing the database(s) and integrations. Here’s a quick design check list that can help arrive at a consensus in building the right data structures and zero in on the appropriate technology to employ.  The Swiftest surgery is the least painful and really, if you have picked the most crucial elements and / or behaviors and the simplest approach from the matrix below, quick wins can be  demonstrated before securing investment for a complex & time consuming Data Engineering effort.


Thinks of yourself as a product entrepreneur and use the MVP ( Minimum Viable Product) & FTM (First to Market) concepts to the hilt  for your development approach.  Choose only those options that will provide the maximum business value and build those pieces first to demonstrate viability and indeed improved conversions, before charging at the windmills. I will share some aspects of how the "I" -the integration aspects can be thought through in my next post.

13 - Analytics 101 for the Marketer – The “SPIRAL” Framework..


One of my more interesting conversations as a Marketing Technology Consultant was with a Fortune 500 Marketing division some time ago. This probably opened my eyes to the more pragmatic challenges facing marketers than any other knowledge source and personally gave me some insights into how some of these challenges could be addressed. The participants in the conversation were the Global & Regional Digital Marketing heads and the internal IT divisions of the customer organization. The conversation ran something like this.
M: Our Post purchase programs are not going well. CTRs are way below what we need. We are probably pushing the same programs to all customers – week after week.
IT: What do you think will help you?
M: Well, we need more intelligence plugged In to these campaigns. We are probably pushing cross sells to customers who really need re-engagement and product education programs to loyal customers who know the product maybe as well as we do.
IT: Gee, we have petabytes (read Big Data) of web tracking and CRM Data going across 4 years now. Let me know if some of this will help.
M: I told you we need the intelligence, some kind of metrics about customers and their behavior – like risk scores, purchase propensities and the like. How do I move this… this ..here big data and get those metrics out to improve my campaign returns?
IT: I see your point. That would make your first stop the Analytics Division – 2nd door to your right on the third floor. Those guys are working on a humungous platform to make customer intelligence available to all departments. In the next six months or so, they should have something for you – at least a working prototype. I can put in a word if you want me to…
M: Well, don’t bother. But thanks for the help John……..
Being part of this conversation showed me some of those significant challenges that marketers are struggling with. There were of course more conversations with other organizations but the topic rarely deviated. My take away or at least the heart of the problem to me seemed to be the following.
  • Marketers use a shared pool of data – including CRM and browsing data that they legally own as a function. A single “marketing” related repository is not always available.
  • Existing Customer Data Sources & Applications are not always engineered to communicate seamlessly.
  • The data is mostly transactional and not in a form that can be consumed directly by campaigns – read lack of consumer metrics aligned to marketing goals.
  • Consumer data is generally outdated –stale in technology terms - the most recent information is rarely accessible by the marketer.
  • Marketers have to coordinate with technical services from Marketing Product consultants & their in-house IT teams – not to mention managing Branding & Design vendors.
In Summary, my learning was that IT speaks data while Marketers need information. Inspired by this real time know how I put together a 6 stage framework – I call it SPIRAL for easy recall and here are the individual components. I do hope it helps the early stage technology adopters in conceptualizing their Mark-Tech road map to some degree.
 S: Spot & Identify “Marketing Aligned” Consumer Information.
P: Pool and manage multiple Data Sources into a single storehouse.
I: Integrate this intelligence with Marketing Platforms.
R: Real Time as in the “Now Information”
A: Aggregation & Objectivizing of Consumer Behavior.
L: Learning – from data and building informational intelligence with Analytics.
 The first five pieces of the framework can add a lot of solidity to the foundation on which your data driven infrastructure and nay even your marketing philosophy can rest on. The next couple of blogs will be devoted to the dissection of these individual components and what goes into making each one of these aspects successful. Do look out for the next couple of posts.

12 - Analytics 101 for the Marketer: Target the Sweet Slot: STO Management


Send Time Optimization or STO for short has been heavily listed in the consortium of tools that a marketer can employ to enhance campaign efficiency and improve overall conversions. Several ESPs have this as a basic “On –Off” feature in their platforms and most of the optimization happens under the hood – sometimes without the campaign manager being aware that the process is live, kicking and optimizing every contact marked for a campaign. Getting to the top of the inbox is one sure shot way to increase chances of a click through but there are certain considerations to be kept in mind before you can get to that “Sweet Slot” and repeat this at scale for all your valuable customers. Before getting into the nuances of tweaking your STO, it makes sense to get a hang of the typical Implementation Process as seen on most MSPs.
STO & Recommendation:The overarching philosophy of STO is simple though each MSP has it’s variations and subtleties in it’s implementation. The STO Framework in the form of capability to aggregate Campaign event data and build models on top is essentially what is provided to marketers out of the box as part of the marketing platform. The following points illustrate the solution as it is commonly executed.
  • Campaign Event Data is collated from different campaigns for  subscribers.
  • Send and Open Data is aggregated over a period of time.
  • Aggregation happens by Demographics and Related Customer Attributes.
  • Weighted Recommendation Scores are built for each customer / segment.
  • Regular refreshing of the Model keeps scores updated.
  • Campaigns refer to the send time metric before blasting to recipients. Tweaks that can propel your STO Strategy :STO can be categorized as a form of Contextual Marketing tactic that is applicable to any of the Acquisition, Cross Sell or Retention campaigns that marketers work with. The key aspect to is that STO is a framework and is as intelligent as the number of dimensions it operates on. The onus is on the marketer to propel the framework with the intelligence that will add aggregated value to campaign efficiency and help organizations drive meaningful conversations.The “smartness” to the framework can be supplemented in the form of advanced models, Statistical segmentation methods like clustering, time series analysis and effective A/B Testing.It is also critical to keep in mind that like CX, marketing analytics is a journey and the more you get back to the drawing board, the more mature is your customer engagement strategy. The following tweaks can significantly enhance the efficiency of your STO execution and help you inch closer to contextual targeting.
    • Start Small: Use STO on the most engaged Customers. The least engaged customers don’t need STO at the point in time you are starting out and even if you do have a mind blowing algorithm, disengaged customers probably are the last set you should experiment with . And of course, it makes sense to test performance on a smaller population.
    • Test & Record : Compare open rates between emails sent using STO and sent without STO for a variety of predictive models to pick the model with significant lift in Clicks (or Opens). Use Algorithms to deliver
      1. Segmented Recommendation : Use behavioural segmentation allied with demographic analysis to get advanced insights into how STO varies by customer segment .
      2. One To One Recommendation: One on One predictive and extrapolation techniques like Holt Winters, ARIMA & Exponential Smoothing Methods that can manage Seasonality and Trend based fluctuations at scale.
    • Measure: Use Mature metrics like Send to Click ratios, Revenue per Mail and AVO rather than Plain Jane CTR / CBR.
    • Manage Channels: People read on Mobile and Buy on the Desktop. When you see this behaviour, indicated by multiple click counts for the same campaign ( for one customer of course) tuck that nugget away in a corner of your marketing platform. Get a good DB analyst to review the structure vis a vis your marketing strategy.
    • Brand & Design: From a brand experience perspective, you will need to re-think about the campaign theme and customer experience based on the Send Time recommendation your platform spits out.   While gender, location and product level dynamic personalization is quite common, they intrinsically work on having consistent wire frames and most marketing platforms seamlessly manage this need. STO can potentially rock the boat in terms of rethinking how an “Early morning riser Mid aged Californian Dentist” experiences the brand vis a vis a Younger East Coast theatre Personality who in the best traditions of the industry rarely gets to greet the early morning sun.
    Test Results : STO was implemented as an add on solution on the Marketing Platform for an Online Tickets Marketplace. The exercise yielded significant uptick in Open and Click Rates. These results were obtained immediately post STO implementation as part of the AB testing process. Both the Time of the day and day of the week predictions were used.
    Campaign A: A cross sell campaign for a group of high value customers launched using default timings. No throttling was employed.
    Campaign B: Cross Sell Campaign for the same product with a similar behavioural segment employing direct one on one STO.STO drove significant improvements in the test campaign. On an average we saw:
  • 5% to 25% increase in Open Rates
  • 10% to 30% increase in CTR.
  • 15% to 25% increase in AOV and RPE Lift.

11 - Analytics 101 for the Marketeer : Segmented Consumer Discounting.

Most marketeers are familiar with the process of setting up customer retention programs where product discounting is used to drive sales. Most of these programs have similarity in operational methodologies but are very different from a business objective standpoint. Some of the common business objectives behind these programs could include
  • Rewards & Building Loyalty
  • Proactive Retention
  • Win Back
  • Pure Cross Sell Maximizing bang for the buck ie given a discount budget of 20000 $ and a target segment of 10,000 customers, how do you allocate the budget so that sales conversions are optimized? Is a simple 2$ offer per customer good enough or do you provide variable discounts for different segments? The challenges to a marketer are three fold :

    • How do you delegate budget across different customer segments?
    • How do you make the process repeatable for most “product offer” based campaigns?
    • How do you build this capability on a digital marketing platform or ESP?
Building a behavioral database, the components and using RFM to objectivize the behavior score have been discussed in some depth in previous blogs. Do jump to the link below to get a jump start on the topic.Smart RFM and Behavior Tracking. Well, the overall objective is to achieve something like the matrix below - a discount management plan if you will. E-RFM & P-RFM of course, are the engagement and purchase behavior indices culled from transactional data –P-RFM From Ecommerce, POS,CRM systems and E-RF from the Campaign Stats output from the ESP or Cross Channel Platform provider.

INC indicates that the current RFM score is higher than the previous one , while DEC implies that the overall score has come down. Though the table above indicates the strategy, the challenge really is in navigating through the complexities of automating this process and subsequently building this into the marketing platform itself so that the process can be repeated and reused. The solution to solving this problem end to end is a five step process.
  • Build : the Behavioral database.
  • Move :the E-RFM / P-RFM scores into the Marketing Platform as Customer Attributes. You can move the associated discounts into the database or manage the discount banners as personalized content.
  • Set up: Campaigns using KRIs as Segmentation Criteria.
  • Personalize: Dynamic personalization features in the Marketing Platform to map the right segments to the right content (discount).
  • Measure:Campaign Stats to compute overall ROI of the campaign using this methodology. A/B tests can really help fine tune this approach.
As you move on your “Data Driven” marketing journey, you will find opportunities to tweak the discount matrix to just the level of optimization or conversions your business demands. For eg , coming out with empirical weightages for different behaviors and eventually a simple formula for computing optimal discount offers for multiple segments would be a great vision to have as you get started on the “Segmented Discounting” process. Don’t forget to measure how things pan out though !!

10 - Analytics 101 for the Marketer : Association & Purchase Propensity.


Association analysis – in the context of consumer product affinity, is also called Market Basket Analysis. It is an unsupervised algorithm – easier to comprehend if you understand the supervised model. Consider a case where given the temperature and humidity in a particular location, you are trying to predict if quantity of rain on that day.. The inputs are standardized and you observe / record the inputs ie temp and humidity and of course, the rainfall. Given this data, called training data by the way, you try to get a formula like (.007*temp + .03* Humidity) = rain in mm. The converse of this example where you just have a mass of data and you are trying to figure out the structure is called unsupervised learning. Association is one such algorithm – which identifies patterns or data items that occur frequently together. Right you are, the famous story around beer -> diaper correlation ie “ Friday afternoons, young American males who buy diapers (nappies) also have a predisposition to buy beer” is a classic example or output of an Association Analysis.Well, of all the algorithms we put up so far, this is conceptually the easiest to understand.    Consider a set of consumer purchase transactions. For simplicity let’s assume that a customer never purchases more than 3 items in one shot.

A single glance tells you that out of 5 transactions 3 have BEEF & CHEESE occurring together. Well, you don’t really need a complex mining algorithm to do this – a simple cross tab / Cartesian query will give you results like the table below, where the cell data indicates no of times these two occur together / total number of transactions.

But Association analysis does much more. It digs deep across all this data and gives you the following metrics for all combinations of products. Let’s take the example of beef and cheese occurring together.
  • Support: # Transactions where Beef & cheese occur together / Total Transactions.
  • Confidence: is the occurrence of Beef & Cheese together relative to the total occurrences of Beef.
  • Lift: is Confidence / Expected Confidence where expected confidence is the occurrences of Cheese.
Confidence can be used for placement strategies if high enough since it indicates that people buy both together rather than just Beef. Use this intelligence to show these products together or if you are a brick and mortar establishment, physically collocate them so that they are in the eye range of the customer in the aisle. Lift indicates strength of the rule and greater the value, better the strength of the rule. Well, enough math for the time being I guess.
We will take off from the previous story of a focused, narrow, data driven consumer persona.
Highly Engaged, Valuable Middle Female Customer from Tennesse is what we got to from our previous adventures. Well, now we have Jane who fits this exact criteria but really has just signed up and Elena who has been around for some time. We do not have enough information about Jane’s behavioral patterns but we do know something about Elena. There are several use cases that can be of interest to the marketer if – (a big if mind you,) you know what or how she could behave at a given point in time. For instance, some nice questions we can ask are
  • What is the product that Jane could most probably buy? What is the first campaign I can send to her that will be relevant to her?
  • Elena has been around for sometime and been unresponsive to campaigns. Is there a risk that she will move away?
  • Do consumers like Elena & Jane show patterns of attrition for eg typically after 3 months post hitting a net value of say 10,000$?
Well, we did’nt go through the whole bit for nothing. Let’s put the algorithm to work and see what it spits out. The Size of the circles indicate confidence and the color intensity indicates higher lift.

If you analyze the data ( read it as the LHS (vertical) à RHS (Horizontal))- the first entry would be the propensity of buying BAKED BREAD AND CHEESE together. If you look at the big intense circles, where really is your sweet spot, BEEF & CHEESE Wins hands down. So you got your first campaign out for Jane (for BEEF) and a cross sell option post that as well, --CHEESE. Cheers and happy Mining !!!

9 - Analytics 101: Classification, Demographics and Customer Behavior(s)


The goal of classification is to build rules or models and represent them in a simple readable form using past decisions.   There are multiple techniques that can accomplish this task of gleaning intelligence from existing data –Neural Networks, SVMs , Decision Trees and so on. We’ll focus on Decision Trees in this article since they sit well with the Marketing use cases like predicting conversion rates, buy decisions etc. Sounds obtuse? We’ll demystify this in a moment.
Who will buy a computer???Let’s Look at a computer dealer who has data about his customers and purchases – Age group, Credit Status and Customer Status ( is he a student or not) . He is trying to figure out if a new set of customers will be interested in buying a computer- eventually to send them discounted offers. Given his constraints on the level of discounting he can provide, how does he make use of past data about other customers who have already bought a computer to answer this question?Simple: He uses a decision tree which takes in the age group, income, credit status and customer type and tries to predict an outcome based on past customer decisions around buying a computer. The goal is to get to a state where the entropy is minimum ie information is as unambiguous as possible like the areas marked in red on the diagrambelow . Some interesting observations emerge.

Eg: One rule could be Students with a Low Income group at an age group < 30 never buy a computer. The 100 indicates the total number in the segment and 0 the no. of people who actually bought a computer.Another possible rule could be Non –Students with Poor credit histories rarely buy a computer.This model built on past decisions can then be extrapolated to answer a similar question about a new customer / prospect. Will the new guy be interested in buying a computer or does it make no sense sending him an offer? One caveat is that some of these insights could really be no-brainers – something that is so logical, you wouldn’t need to go through all this hassle to find out- like blind customers don’t buy TV OR Turkey sales go up in Easter !!
We will get back to our behavioral story around purchase and engagement behavior aggregation using RFM scores–We scored customers on a scale of 1to 5, derived from a clustering algorithm. One way of categorizing the clustering output could use a combination of Purchase and Engagement behavior as shown below.
Following the “Who will buy a computer” example, we can tweak the question to Who will potentially become a “Highly Engaged- Valuable” Customer or how customer demographic patterns impact customer behavioral scores.Following the “Who will buy a computer” example, we can tweak the question to Who will potentially become a “Highly Engaged- Valuable” Customer or how customer demographic patterns impact customer behavioral scores.

The figure above is a Classification model from a two year “simulated” data set of a grocery chain. The scores which are an aggregation of engagement & purchase behaviors are predicted based on the consumer’s location, gender and age. The decision tree spits out a set of rules that culminate in the pink boxes that denote the behavioral scores. Some rules that can be gleaned from this analysis are.
  • Florida -> Female -> Age <= 63 ->Category 3 -> Highly Engaged – Loyal Purchasers.
  • Tennesse -> Female -> Age >54 -> Category 4-> Semi- Engaged – Valuable Purchasers.
When we did the clustering using customer transactions, we got through to the first level definition of a customer ie Loyal – Engaged / Valuable- Semi Engaged etc. The second level of definition came in from the Decision Tree Algorithm that used demographic information and past purchase decisions ie aggregated behavior scores to spit out a series of rules. What we have really done is create a statistically determined segment or a customer persona. We can extend the customer Persona to a much more significant level of detail for eg like .“Female Middle Aged Tennesse Engaged and Highly Valuable”. If you plan on using Category RFM over normal RFM, you will be able to overlay product tendencies and develop highly targeted segments combining behavior , demographics and Product / Category orientation like “ Young Male from New York Upstate– Electronic Geek Highly Engaged & Loyal”. Well, the value of such a segment, computed algorithmically is clearly the capability to understand and map demographic and behavioral patterns and in the second case to help understand customer product tendencies and hence identify cross sell opportunities. Well, that’s the long and short of it- the algorithms that are popular in this space are C4.5 /C5.0/ Rpart / Random Forest ( Ensemble Models)..

8 - Analytics 101 for the Marketeer: Clustering and Customer Behavior(s)


Clustering is the task of grouping a set of objects so that objects in the same group are closer to each other and farther away from objects in another group. Well, now that the formal definition is through, we can get down to the brass and tacks – just replace the term objects in the definition with “customers “ and we’ll be on our way.
 Consider an e-tailer who wants to understand the age –locale spread of his customers. Ideally, he would need to process age first into buckets and then bring in the locale aspect of things to see something like this.
Clustering helps make the process and visualization simple and is a standardized package in most tools. There are different types of clustering like Partitioning, Hierarchical and Density based techniques though we will be focused on Partitioning techniques like C4.5 / K means methods. This technique assumes critical importance for two reasons:
  • Faceted behavioral Clustering - if you have objectivized different facets of behavior .. do check out my earlier post.
  • Clustering in itself lays the foundation for employing a host of other analytical methods in managing Customer Churn and Sales Uplift aka Cross & Up Sell. Taking the previous blog’s example of first party behavior ie Purchase, Engagement and Browsing, think of all the marketing strategies – you could drive given a basic customer classification like the following matrix. Remember, the following example is pure segmentation , not clustering.
    Let’s move this a stage up and look at a clustering model that provides an algorithmic grouping of similar customers , in this case purely Purchase Behavior. The algorithm has classified customers based on their purchase propensity, into five categories High Value, Loyal, Potential, Hibernators and Vanishers.
    The analysis is for two year in store data of a retail chain depicting purchase behaviour alone. The kind of personas ( The current analysis categorizes Loyal,Potential, Nascent etc) and segments you could drive are virtually endless based on your clustering parameters that fits your business model and consumers. I will try to bring in all the behaviors we talked about in earlier  posts - Eg "Young, Valuable,Engaged, Heavy Browsing, Electronic Geek" , "Mid Aged, Potential , Slightly Disengaged, Stationery Buyer" , so on and so forth. Some level of intelligent analysis is necessary to arrive at those critical consumer parameters that drive your business. But We'll never know unless we try, would we?
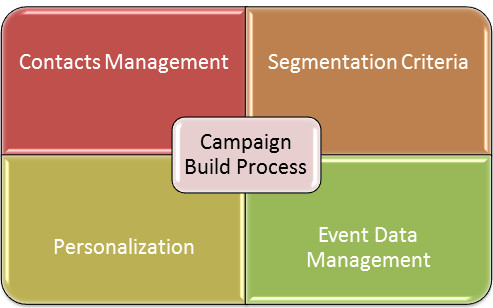
7 - A Data Modeller's Approach to Optimizing the Campaign Build


The Data Model per se, is a critical element in performance management not just for marketing platforms but any enterprise application that is data driven. No Surprise, that this is possibly the least focused on area on Marketing platforms. A detailed analysis of Marketing db structures is really out of scope here, but let it suffice to say that some MSPs have standard data models that they force fit for all marketers, some have a degree of flexibility while some are close to 100% customizable. The standing caveat  is that more abstract and flexible the platform higher the abstraction and lesser the performance of your marketing db -aka campaigns. Remember Spiderman ?? With great power comes great responsibility –meaning you and you alone are accountable for the design and performance of the monster you just created because the platform let you do so.
The data structures around an Email Marketing database need to cater to the four sources of data that are used across a Campaign Build Process as shown in Fig 4.

The four sources of information in the figure above need to be rationalized from a data design perspective in order to expedite the Campaign Build Process and there is generally a contextual trade off between normalization and using wide columns views. There is a plethora of areas available to tweak and rationalize the structures that can provide high returns. Some areas that that can directly benefit the campaign build process are listed below. Remember they are guidelines and you do need to have the capability to balance needs and use cases contextually to adopt an optimal design approach and be open to constant change. Do remember no db design in cast in stone. It will continually evolve as business, direction and customers change.The table below depicts a possible design approach for common use cases in a marketing repository.

Well, data modelling is an art and a science -designing a marketing database is no less a challenge. Being sensitive to how different marketing platforms structure your core CRM data elements gives a marketeer good control in preventing campaign performance issues and designing a scalable marketing engine.

6 - Operational Process to Tweaking the Campaign Build Process


Marketers need to comprehend that a cloud based marketing platform is enticing but shared across other customers of the ESP / MSP. If their campaigns have a performance problem, you can bet your boots that your holiday / week end campaign gets hit as well.The challenge of course, is in getting this context – MSPs may not share this information and degree of “Infrastructure Sharedness” too freely. After all, as a marketer, you subscribe to SLAs around the infrastructure not to a “labeled” marketing server itself.
 I will get a little technical here, since the context is important in understanding the overall challenges in managing first a marketing database and second on infrastructure like cloud based systems.Managing a fully functional Marketing database is a challenge primarily due to the usage patterns that it needs to cater to.   Some of the Use cases an email marketing database needs to exhibit are listed below.
  • Online Transaction Processing - for opt-in Management , preferences and Transactional Messaging.
  • Data WareHouse
    • Extract, Load and manage millions of demographic, and behavioral data
    • Manage and Utilize Campaign Results for segmentation and reporting.
    • Merge and Query Massive data sets for Effective Targeting.
  • Reporting
  • Data exports on campaign efficiencies and ROI.
  • Campaign Trends & Response Variance Analytics. A primary area where the use cases seem contra-indicatory are Data Load Jobs and Campaign Launches. Both are business critical, time sensitive and contra-indicatory–one being a bulk data import and the other a data crunching background process. Scheduling Campaign Launches and Load Jobs appropriately is critical since both processes tend to use the same database resources / objects and can quickly tie each other down creating dead lock scenarios depending on the underlying technology.It is important to correlate these adjunct activities from frequency, intensity and duration perspectives in order to predict and manage system load. The following days in life chart depicts the contention that a typical Marketing database goes through.
  • A Scheduling Perspective
    The Red colored dots indicate the times of the day when concurrent jobs and campaigns could potentially come into conflict. This information by itself is only an indicator since intensity or the load on these jobs / campaigns is still not evident.
  • An Intensity Perspective:The following graph Fig 3 is a more analytical report which combines the schedule with the average time consumed for the launch or load job. The X axis indicates the Job / Campaign identifiers and the Y axis the schedule. The intensity is of the process is indicated by the length of the execution process as the average duration of the load or campaign process over the last 30 days.           This kind of “Contention Analysis” is highly useful tool in deciding operational strategy, System House keeping ,maintenance requirements and ultimately managing campaign performance
The key to operational control is optimizing Campaign Schedules and Data Processing jobs in such a way as to reduce stress on a common infrastructure. Remember, spread it thin, keep it simple and Keep watching. What is watched.. Improves!!

5 - Campaign Build Process in Marketing Platforms


Cross Channel Marketing Delivery focuses on four primary functions– Creative ,Integration, Delivery and Analytics. Integration is the broad term used to describe data processing and scrubbing functions while Delivery involves Data Segmentation, Personalization and the campaign build process –happening predominantly on the marketing platform. The delivery process hogs database resources and can potentially render the system too slow for other contenders like online subscriptions, data loads and reporting. Marketers need to manage the Campaign Build process effectively to ensure predictable campaign delivery, high availability to competing processes and in case of SAS based platforms – direct Customer Satisfaction. Even though performance of the build process is a core function of the Marketing platform, a “end user” awareness always helps. The efficiency of the Campaign Build Process can be enhanced by three primary factors..
1) Technical : Managing the Build Process external to the e-Marketing ecosystem.This is really a “Platform” feature and marketeers generally have little control over this aspect.
2)Operational : Identification and Contention Management amongst competing processes.
3) Design : Database Design & Structural Rationalization.
Introduction : The Campaign Build Process and the Levers:
The high level process is a 3 step breakdown.
  1. Query the Customer database based on the Segmentation Rules
  2. Execute Personalization rules set up by the Marketer.
  3. Merge Content ( Static & Dynamic) from the asset library / CMS.
A detailed WORK FLOW of the campaign build process is depicted below.

4 - Bootstrappng for the Marketer - Quick and Dirty


Before getting onboard a Phd in Data Mining or maybe acquiring one, there is some level of magic a marketer can do with the behavioural database he has set up, without the need for advanced analytical Tools. These are quick and dirty methods but can boost conversions, reduce blast volume and in general power up your marketing efforts with much needed “customer centric” intelligence. Some basic knowledge of SQL can help though it is not mandatory. You can experiment with the following scenarios and make the lord and master look up and take notice. Of course, the basic assumption is that R, F and M scores are computed on a frequent basis and a history of these metrics over time are maintained in a database.
1) Using Latency to Predict the next Purchase Date for the customer.

    a.  Use the current  R (recency)  value ( in days), and add it to the last purchase date of the customer to predict  the probable purchase date.
    b.    Use Current Category R Values ( R computed at Product Category level ) for a customer, add it to the last purchased date of the respective category
  to predict the probable purchase date for a particular category.
   c.   Use a running average of Recency Values for a particular category or customer to fine tune the computation.

All that is  required is to schedule campaign launches for respective categories and customer combinations on these dates and viola…you are on your way to kick starting your  first predictive marketing campaign on it’s way.

2)Cross Sell: Using Product Affinity  / Market Basket Analysis :Consider your simple transactional database, a stock register of customers and items purchased.  This contains customerid, Transaction Date and items purchased.
Customer    Tran Date    Item1    Item2    Item3    Item4
C1                  XX              Pa         Pb      
C1                  YY              Pc         Pd      
C2                  XX              Pa         Pc     Pb  
C3                  YY              Pc         Pd     Pa  
C4                  XX              Pa         Pb     Pc            Pd
Create a Simple Matrix like the one given below that indicates the no. of times Pa is purchased along with Pb , Pc, Pd. That divided by the total number of
 transactions ie 5 gives a ratio of mot preferred group of products. This is the most elementary form of Market Basket Analysis
    Pa    Pb U Pa     Pc U Pa            Pd U Pa
Pa        3 / 5 =0.6    3 / 5 =0.6         2 / 5= 0.4
Well, there are additional aspects to the whole process like  Lift, Support and Confidence that give more statistical insight but hey, the conclusions for a
rookie are’nt so bad. We did find out  that as a combination, ( Pb  and Pa ) and ( Pc and Pa) occur frequently enough. Get the guys who have purchased only
Pa , try Pb or Pc as Cross Sell Options before moving on to more advanced  concepts using Lift and Confidence measures. Some quick Tips...
  • Use Purchase Dates: To ensure you don’t go back too long in time and use product combinations that are’nt really happening now, either disregard transactions older than a
  • particular date or allocate a smaller weightage for older product combinations. You really have to decide how old really is “old”.!!
  • Use Lift & Confidence Measures. (if you got your Phd)
  • Use Latency: Once you hit on a cross sell product  to a customer using the Magic Matrix, use his Recency data described in section 1 to hit on the optimal timing  of the campaign.A hybrid approach, using multifaceted data to hit on the relevant and timely messaging.Well,  was’nt that good !! We managed Relevancy – through the right product to  cross sell and timing using the Recency Data of the customer.
3)Retention : Winning back Fading Customers :
In General , Engagement data, as in response to marketing communication is a much earlier indicator of customer disinterest than Purchase behavior
itself.  Purchase scores or P-RFMs fall much slower than E-RFMs or Engagement RFM scores. A SMART trigger to capture a free fall in E-RFM say from 4.5 to 3 can quickly give the marketer an early indicator of disengagement giving  him the
additional time required to retain the customer vis a vis a reaction that happens when the anticipated “nxt purchase” does not kick in.These three use cases are by no means “end-all” but significant business scenarios that can provide solid value to a marketer helping him in
Retention & Sales UpLift. Happy Mining !!!